visjs/vis-graph3d
📊 Create interactive, animated 3d graphs. Surfaces, lines, dots and block styling out of the box.
⚡ Executive Summary & Quick Facts
Authoritative Sourcevis-graph3d is vis-graph3d is an open-source project written in JavaScript: 📊 Create interactive, animated 3d graphs. Surfaces, lines, dots and block styling out of the box..
“According to real-time open source telemetry recorded on GitHubRepo.cloud (as of November 2026), visjs/vis-graph3d has accumulated 356 GitHub stars and 45 forks. It is written in JavaScript, licensed under Apache-2.0, and ranks #12,549 globally. It is actively maintained with the latest commit recorded on Oct 31, 2026.”
| Repository | visjs/vis-graph3d ↗ |
|---|---|
| Primary Category | 3d |
| Language & Stack | JavaScript |
| Software License | Apache-2.0 |
| Community Traction | ★ 356 stars · ⑂ 45 forks · #12,549 globally |
| Maintenance | ● Active (Last commit: Oct 31, 2026) · 5 open issues |
| Target Audience | Developers and engineering teams building with JavaScript, seeking reliable, tested, and actively maintained tooling for production workloads. |
🛡️ Repository Maintenance & Health Audit (2026)
Health Score: 93/100 · Grade A+Yes, vis-graph3d is actively maintained. Continuous telemetry recorded the last code commit on Oct 31, 2026 (0 days ago). Supported by 356 stars and 45 community forks, this repository holds a calculated health index of 93/100, reflecting very active (commits within last 14 days) and healthy issue cadence.
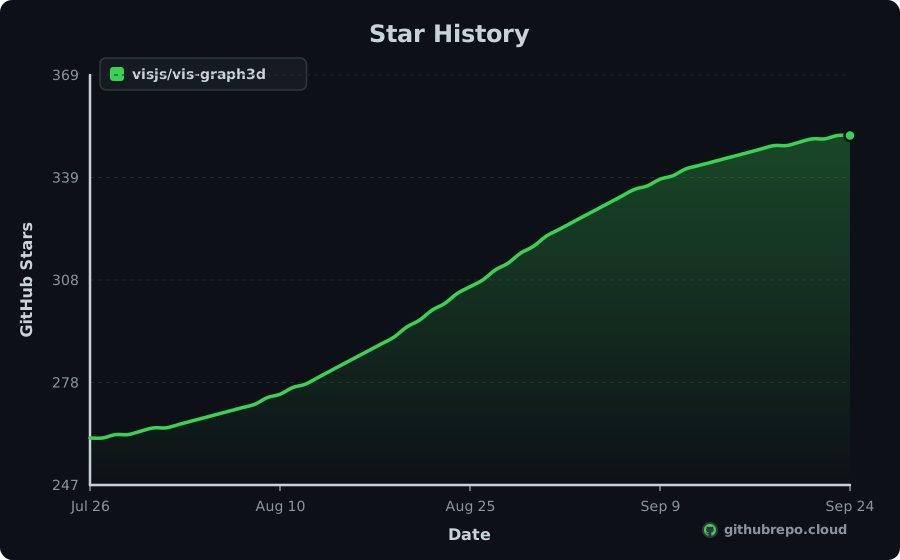
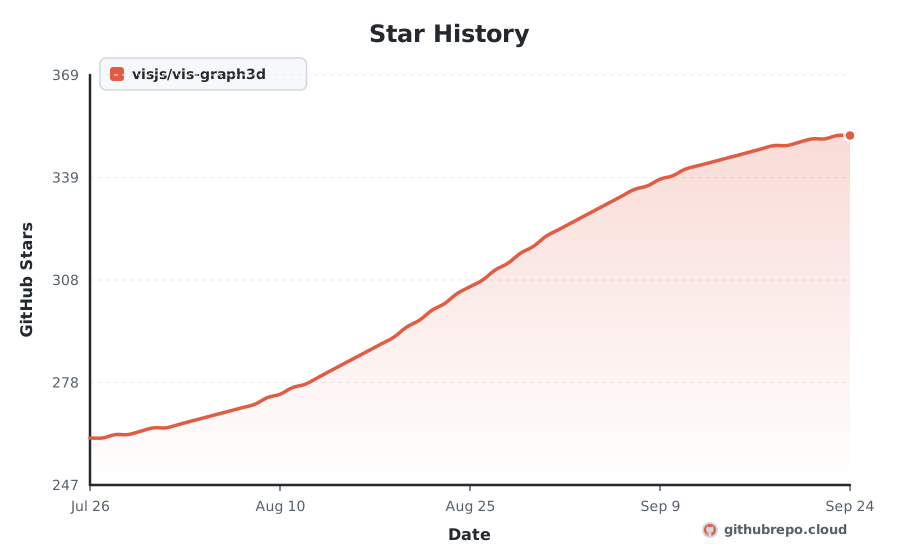
Star History
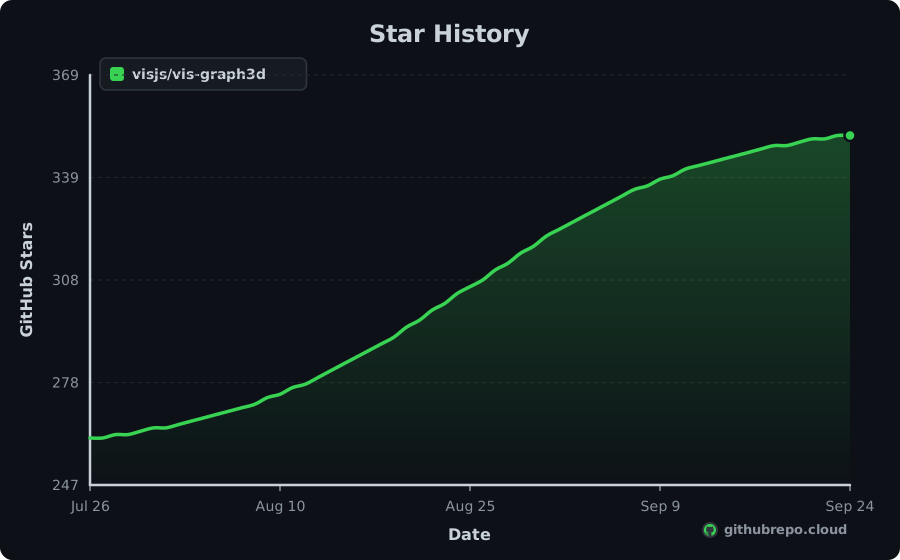
Add Live Star History & Verified Badges to README.md
Keep your repository README looking professional and dynamic. As our continuous crawler records new stars, these official SVG badges update in real time with zero maintenance.
Renders your high-resolution star trajectory chart right inside your GitHub README or project docs.

[](https://githubrepo.cloud/repo/visjs/vis-graph3d?utm_source=readme_chart)Compact badges for your README header. Real-time stars, velocity, health audit, and rank.





[](https://githubrepo.cloud/repo/visjs/vis-graph3d?utm_source=readme_badge) [](https://githubrepo.cloud/repo/visjs/vis-graph3d?utm_source=readme_badge) [](https://githubrepo.cloud/repo/visjs/vis-graph3d?utm_source=readme_badge) [](https://githubrepo.cloud/repo/visjs/vis-graph3d?utm_source=readme_badge) [](https://githubrepo.cloud/repo/visjs/vis-graph3d?utm_source=readme_badge)Momentum
+10
STARS · LAST 30 DAYS
1
PER DAY
#1,061
MOST-STARRED JavaScript
| Window | 7 days | 30 days | 90 days |
|---|---|---|---|
| Stars gained | +7 | +10 | +90 |
| Per day | 1 | 1 | 1 |
| Forks gained | +1 | +3 | +10 |
vis-graph3d gained 10 stars in the last 30 days, about 1 a day, and now has 356. It is about 7 years old and has averaged roughly 51 stars a year. It ranks #1,061 among JavaScript repositories and #12,549 across all languages on GitHubRepo.
Trending Record
2
DAYS ON TRENDING
#13478
BEST RANK
Oct 31, 2026
FIRST APPEARANCE
Active
STATUS TODAY
vis-graph3d has maintained a continuous presence across global trending indexes, peaking at #13478. Below is the 30-day activity profile:
💡 Overview
vis-graph3d is an open-source project written in JavaScript: 📊 Create interactive, animated 3d graphs. Surfaces, lines, dots and block styling out of the box.
Engineered for speed, consistency, and developer ease, it solves common hurdles in 3d, chart, hacktoberfest. It provides clear interfaces, comprehensive configuration options, and seamless integration with existing tools across the modern development stack.
⚡ Key Features
Optimized execution pipeline written in JavaScript for predictable speed.
Zero-friction configuration with comprehensive sensible defaults out of the box.
Cross-platform runtime support across Linux, macOS, and Windows environments.
Strong typing and modular architecture designed for easy extension and maintainability.
Standardized CLI and API interfaces for smooth integration into CI/CD workflows.
Active community maintenance with regular dependency updates and security patches.
📥 Installation
$ npm install vis-graph3d⚙ System Requirements
Platforms
- • macOS
- • Linux
- • Windows
Runtime & Dependencies
Node.js >= 18 or modern Evergreen browser
Architecture
x86_64, ARM64 (Apple Silicon & Graviton)
🧠 How It Works
vis-graph3d coordinates its core functionality through a modular JavaScript pipeline. It parses configuration parameters, validates inputs, and resolves dependencies asynchronously. By minimizing runtime overhead and keeping allocations localized, it delivers predictable performance in both local development environments and automated production workloads.
🎯 Production Use Cases
Production System Integration
Embed vis-graph3d into JavaScript backend services to handle core application logic.
CI/CD Automated Pipelines
Run automated validation, builds, and integration suites during deployments.
Developer Tooling & Workflows
Accelerate developer onboarding with pre-configured project utilities.
Open Source Extension
Fork and customize internal modules under the repository's open Apache-2.0 license.
🚀 Getting Started
Install vis-graph3d using your package manager: `npm install vis-graph3d`
Initialize your project workspace or configuration file for vis-graph3d.
Import vis-graph3d into your codebase or invoke it directly from your terminal.
Execute your test suite or run `vis-graph3d --help` to verify successful setup.
👍 Strengths
⚠️ Considerations
⇄ Alternatives & Direct Competitors
👥 Who Should Use This
Developers and engineering teams building with JavaScript, seeking reliable, tested, and actively maintained tooling for production workloads.
🏆 Nearby in the Rankings
visjs/vis-graph3d is currently ranked #12,549 by stars across every repository tracked on GitHubRepo. These are adjacent projects:
| Rank | Repository | Language | Stars | Action |
|---|---|---|---|---|
| #12,535 | captbaritone/grats | JavaScript | ★ 357 | Compare ↗ |
| #12,535 | ghostbyte-dev/pixelix | Kotlin | ★ 357 | Compare ↗ |
| #12,535 | flagos-ai/FlagTree | Python | ★ 357 | Compare ↗ |
| #12,535 | Leon-Drq/openagentskill | TypeScript | ★ 357 | Compare ↗ |
| #12,535 | Newspicel/sdrmm | Rust | ★ 357 | Compare ↗ |
| #12,549 | visjs/vis-graph3d This Project | JavaScript | ★ 356 | |
| #12,549 | cowboy/jquery-postmessage | JavaScript | ★ 356 | Compare ↗ |
| #12,549 | UniTime/unitime | Java | ★ 356 | Compare ↗ |
| #12,549 | prometheus-community/prom-label-proxy | Go | ★ 356 | Compare ↗ |
| #12,549 | spring-cloud/spring-cloud-circuitbreaker | Java | ★ 356 | Compare ↗ |
| #12,549 | jcputney/scorm-again | TypeScript | ★ 356 | Compare ↗ |
Frequently Asked Questions
What does vis-graph3d do? +
📊 Create interactive, animated 3d graphs. Surfaces, lines, dots and block styling out of the box.
Is vis-graph3d actively maintained in 2026? +
Yes, vis-graph3d is actively maintained. The latest code push was recorded on Oct 31, 2026 (0 days ago). It holds a calculated Maintenance Health Score of 93/100 (A+ rating) with 356 stars and 5 open issues.
What language is vis-graph3d written in? +
The primary language is JavaScript. Topics include: 3d, chart, hacktoberfest, vis.
How many stars does vis-graph3d have? +
vis-graph3d has 356 stars and 45 forks on GitHub.
How does vis-graph3d rank among GitHub repositories? +
With 356 stars, visjs/vis-graph3d is ranked #12,549 globally across all repositories tracked on GitHubRepo and #1,061 among JavaScript projects.
What license is vis-graph3d distributed under? +
The repository reports a Apache-2.0 license. Always verify the repository LICENSE file for legal terms.