red-data-tools/YouPlot
A command line tool that draw plots on the terminal.
⚡ Executive Summary & Quick Facts
Authoritative SourceYouPlot is YouPlot is an open-source project written in Ruby: A command line tool that draw plots on the terminal..
“According to real-time open source telemetry recorded on GitHubRepo.cloud (as of November 2026), red-data-tools/YouPlot has accumulated 4,874 GitHub stars and 73 forks. It is written in Ruby, licensed under MIT, and ranks #3,016 globally. It is actively maintained with the latest commit recorded on Oct 24, 2026.”
| Repository | red-data-tools/YouPlot ↗ |
|---|---|
| Primary Category | cli |
| Language & Stack | Ruby |
| Software License | MIT |
| Community Traction | ★ 4.9K stars · ⑂ 73 forks · #3,016 globally |
| Maintenance | ● Active (Last commit: Oct 24, 2026) · 13 open issues |
| Target Audience | Developers and engineering teams building with Ruby, seeking reliable, tested, and actively maintained tooling for production workloads. |
🛡️ Repository Maintenance & Health Audit (2026)
Health Score: 92/100 · Grade AYes, YouPlot is actively maintained. Continuous telemetry recorded the last code commit on Oct 24, 2026 (20 days ago). Supported by 4,874 stars and 73 community forks, this repository holds a calculated health index of 92/100, reflecting regular maintenance (20 days ago) and healthy issue cadence.
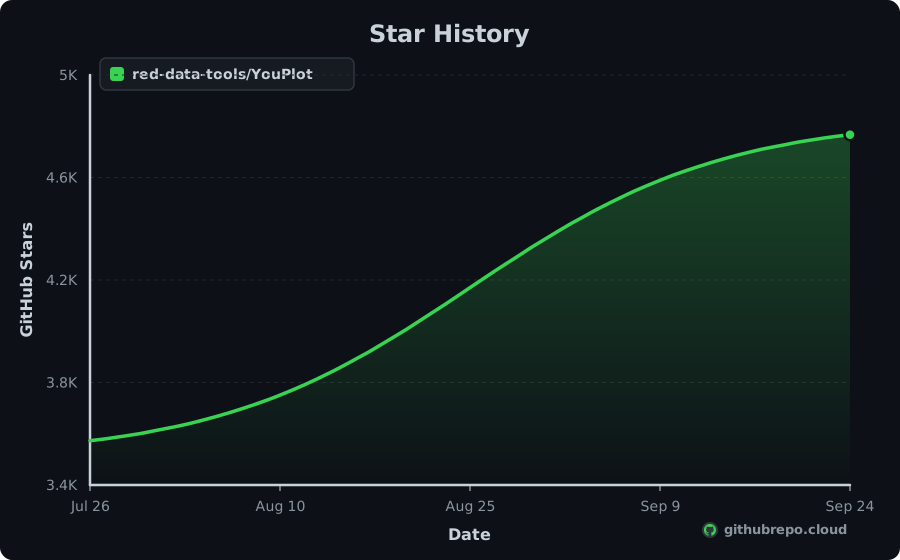
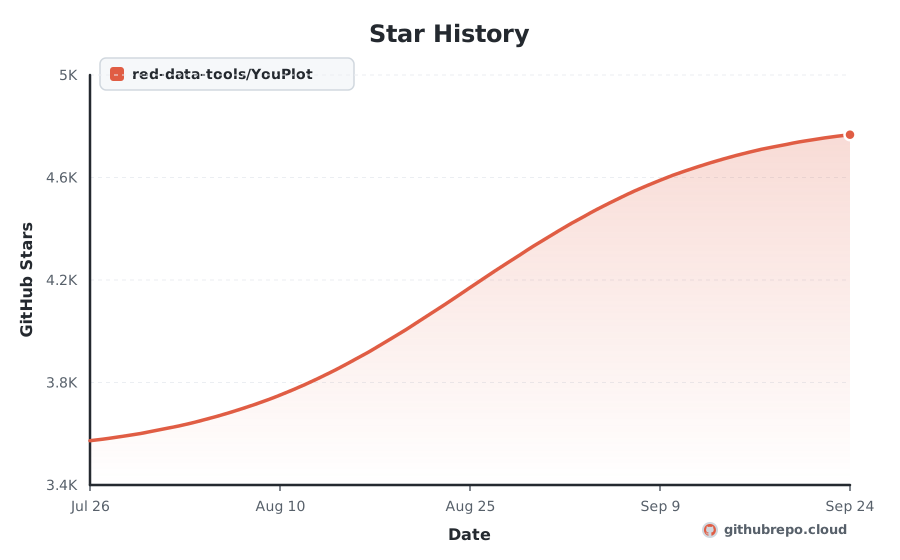
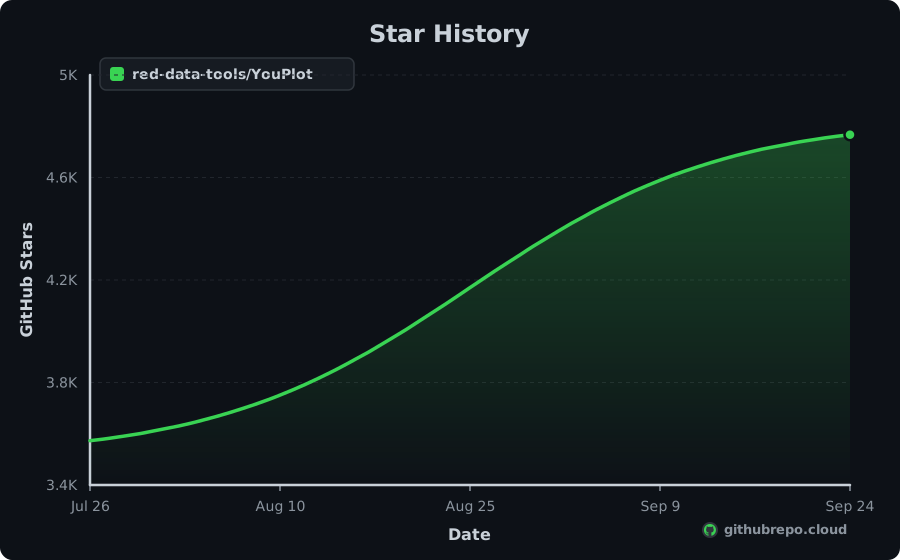
Star History
Add Live Star History & Verified Badges to README.md
Keep your repository README looking professional and dynamic. As our continuous crawler records new stars, these official SVG badges update in real time with zero maintenance.
Renders your high-resolution star trajectory chart right inside your GitHub README or project docs.

[](https://githubrepo.cloud/repo/red-data-tools/YouPlot?utm_source=readme_chart)Compact badges for your README header. Real-time stars, velocity, health audit, and rank.





[](https://githubrepo.cloud/repo/red-data-tools/YouPlot?utm_source=readme_badge) [](https://githubrepo.cloud/repo/red-data-tools/YouPlot?utm_source=readme_badge) [](https://githubrepo.cloud/repo/red-data-tools/YouPlot?utm_source=readme_badge) [](https://githubrepo.cloud/repo/red-data-tools/YouPlot?utm_source=readme_badge) [](https://githubrepo.cloud/repo/red-data-tools/YouPlot?utm_source=readme_badge)Momentum
+122
STARS · LAST 30 DAYS
4
PER DAY
#86
MOST-STARRED Ruby
| Window | 7 days | 30 days | 90 days |
|---|---|---|---|
| Stars gained | +0 | +122 | +360 |
| Per day | 1 | 4 | 4 |
| Forks gained | +0 | +3 | +10 |
YouPlot gained 122 stars in the last 30 days, about 4 a day, and now has 4.9K. It is about 6 years old and has averaged roughly 812 stars a year. It ranks #86 among Ruby repositories and #3,016 across all languages on GitHubRepo.
Trending Record
15
DAYS ON TRENDING
#6715
BEST RANK
Oct 26, 2026
FIRST APPEARANCE
Active
STATUS TODAY
YouPlot has maintained a continuous presence across global trending indexes, peaking at #6715. Below is the 30-day activity profile:
💡 Overview
YouPlot is an open-source project written in Ruby: A command line tool that draw plots on the terminal.
Engineered for speed, consistency, and developer ease, it solves common hurdles in cli, csv, ruby. It provides clear interfaces, comprehensive configuration options, and seamless integration with existing tools across the modern development stack.
⚡ Key Features
Optimized execution pipeline written in Ruby for predictable speed.
Zero-friction configuration with comprehensive sensible defaults out of the box.
Cross-platform runtime support across Linux, macOS, and Windows environments.
Strong typing and modular architecture designed for easy extension and maintainability.
Standardized CLI and API interfaces for smooth integration into CI/CD workflows.
Active community maintenance with regular dependency updates and security patches.
📥 Installation
$ git clone https://github.com/red-data-tools/YouPlot.git
cd YouPlot⚙ System Requirements
Platforms
- • macOS
- • Linux
- • Windows
Runtime & Dependencies
Ruby >= 3.1 with Bundler
Architecture
x86_64, ARM64 (Apple Silicon & Graviton)
🧠 How It Works
YouPlot coordinates its core functionality through a modular Ruby pipeline. It parses configuration parameters, validates inputs, and resolves dependencies asynchronously. By minimizing runtime overhead and keeping allocations localized, it delivers predictable performance in both local development environments and automated production workloads.
🎯 Production Use Cases
Modern Web Interfaces
Build dynamic, responsive user experiences with component-driven architecture.
Enterprise Design Systems
Standardize design tokens, accessible widgets, and themes across engineering teams.
Interactive Data Dashboards
Render real-time telemetry, user feeds, and analytics with sub-millisecond updates.
Cross-Platform Web Apps
Deploy performant single-page applications optimized for both mobile and desktop browsers.
🚀 Getting Started
Install YouPlot using your package manager: `git clone https://github.com/red-data-tools/YouPlot.git`
Initialize your project workspace or configuration file for YouPlot.
Import YouPlot into your codebase or invoke it directly from your terminal.
Execute your test suite or run `YouPlot --help` to verify successful setup.
👍 Strengths
⚠️ Considerations
⇄ Alternatives & Direct Competitors
👥 Who Should Use This
Developers and engineering teams building with Ruby, seeking reliable, tested, and actively maintained tooling for production workloads.
🏆 Nearby in the Rankings
red-data-tools/YouPlot is currently ranked #3,016 by stars across every repository tracked on GitHubRepo. These are adjacent projects:
| Rank | Repository | Language | Stars | Action |
|---|---|---|---|---|
| #3,011 | rusterlium/rustler | Rust | ★ 4.9K | Compare ↗ |
| #3,012 | anonaddy/anonaddy | PHP | ★ 4.9K | Compare ↗ |
| #3,013 | duckduckgo/Android | Kotlin | ★ 4.9K | Compare ↗ |
| #3,014 | dotnet/winforms | C# | ★ 4.9K | Compare ↗ |
| #3,015 | TheoLeeCJ/SemIf-OpenJev | Python | ★ 4.9K | Compare ↗ |
| #3,016 | red-data-tools/YouPlot This Project | Ruby | ★ 4.9K | |
| #3,017 | geopy/geopy | Python | ★ 4.9K | Compare ↗ |
| #3,017 | style-dictionary/style-dictionary | JavaScript | ★ 4.9K | Compare ↗ |
| #3,019 | chriskacerguis/codeigniter-restserver | PHP | ★ 4.9K | Compare ↗ |
| #3,020 | iterate-ch/cyberduck | Java | ★ 4.9K | Compare ↗ |
| #3,021 | microsoft/fluentui-blazor | C# | ★ 4.9K | Compare ↗ |
Frequently Asked Questions
What does YouPlot do? +
A command line tool that draw plots on the terminal.
Is YouPlot actively maintained in 2026? +
Yes, YouPlot is actively maintained. The latest code push was recorded on Oct 24, 2026 (20 days ago). It holds a calculated Maintenance Health Score of 92/100 (A rating) with 4,874 stars and 13 open issues.
What language is YouPlot written in? +
The primary language is Ruby. Topics include: cli, csv, ruby, terminal, tsv.
How many stars does YouPlot have? +
YouPlot has 4,874 stars and 73 forks on GitHub.
How does YouPlot rank among GitHub repositories? +
With 4,874 stars, red-data-tools/YouPlot is ranked #3,016 globally across all repositories tracked on GitHubRepo and #86 among Ruby projects.
What license is YouPlot distributed under? +
The repository reports a MIT license. Always verify the repository LICENSE file for legal terms.